Menu Website

- Home
- MediaOutReach
- Gorilla Technology H1 Revenue Surges 99% to US$78.4 Million; Raises FY2026 Revenue Outlook to at Least US$200 Million

Gorilla Technology H1 Revenue Surges 99% to US$78.4 Million; Raises FY2026 Revenue Outlook to at Least US$200 Million
Selasa, 25 Agustus 2026 | 10:31
Link berita berhasil disalin!

London, United Kingdom -
Newsfile Corp.
- August 24, 2026 - Gorilla Technology Group Inc. (NASDAQ: GRRR)
("Gorilla" or the "Company"), a global solution provider in Security
Intelligence, Network Intelligence, Business Intelligence, IoT
technology and data centres, today announced its unaudited financial
results for the six months ended June 30, 2026.

Gorilla delivered a significant acceleration in revenue and a marked sequential improvement in reported operating performance during the second quarter. The outperformance was principally driven by earlier-than-anticipated delivery across multiple contracted customer programmes, enabling the Company to recognize the associated revenue ahead of its original expectations. This was complemented by continued execution across Gorilla's broader portfolio.
Financial highlights
Statement from Jay Chandan, Chairman and Chief Executive Officer
"This is the clearest evidence yet that Gorilla has entered a different phase of scale," said Jay Chandan, Chairman & CEO.
"In one year we managed to nearly double our first half revenue to US$78.4 million. Our second quarter revenue increased 78% sequentially and 138% year-on-year to US$50.1 million, while our reported operating loss narrowed by approximately 85% compared with Q1.
The progression matters. In the first half, we absorbed a significant share-based compensation charge largely tied to services rendered prior to 2025 and other significant accounting effects. With their removal during the first half of 2026, we are poised for an improvement in operating results.
We are now converting years of preparation into delivery at scale. We are investing in hardware, infrastructure, people and execution capacity because we see a substantial opportunity ahead of us. Infrastructure cannot be switched on like a tap. Equipment must be procured, installed, commissioned and integrated. Customers must migrate workloads and utilisation must then progress toward steady-state levels.
That investment is happening now. During H1, Gorilla deployed approximately US$14.1 million for the acquisition of property and equipment, while property and equipment, including capital work-in-progress, reached approximately US$29.4 million at June 30, 2026. We are building the capacity and delivery platform required to support a much larger business. Our priorities for the remainder of 2026 are unambiguous: bring more capacity into service, increase utilisation, expand the workloads we deliver for existing customers and convert additional demand into revenue. We are on track to meet previously announced delivery timelines. The objective is not simply to deploy hardware. It is to build long-term customer relationships around infrastructure, compute and associated services."
Statement from Bruce Bower, Chief Financial Officer
"The first-half results demonstrate both the scale of Gorilla's investment and the improvement in cash efficiency," said Bruce Bower, Chief Financial Officer.
"On an IFRS basis, Gorilla reported an operating loss of approximately US$47.2 million and a net loss of approximately US$46.9 million. Adjusted EBITDA was a loss of approximately US$14.6 million, and adjusted net loss was approximately US$15.6 million. The reconciliation included below provides investors with the individual adjustments and their respective treatment."
"H1 revenue increased 99.3%, while net cash used in operating activities declined by approximately US$8.2 million, or 65.3%, to US$4.3 million. Put simply, we nearly doubled revenue while reducing operating cash usage from 31.8% to 5.5% of revenue."
"This improvement was achieved while Gorilla deployed approximately US$14.1 million during H1 for the acquisition of property and equipment. Cash deployment may increase as we fund equipment purchases, project-related deposits, construction and commissioning activities. These expenditures represent the planned conversion of liquidity into productive infrastructure and delivery capacity intended to support future revenue-not a weakening of our underlying operating discipline."
"The Company recorded an overall increase in cash of approximately US$79.8 million during H1, driven principally by financing inflows and supported by customer collections. We closed the period with approximately US$179.4 million in cash. As this liquidity is deployed, our cash balance may fluctuate as we fund existing projects and build the capacity required to support future revenue."
"We are investing ahead of the revenue and utilisation curve, but we are doing so from a position of substantial liquidity. Our priorities remain disciplined capital allocation, project execution, improved utilisation and the conversion of infrastructure investment into sustainable revenue and cash flow."
Infrastructure investment and the path to steady state
Gorilla's current financial profile reflects the deliberate acceleration of its AI infrastructure strategy.
Infrastructure projects require capital to be deployed before their full revenue and margin potential can be realized. Hardware procurement is followed by installation, commissioning, integration, customer onboarding, workload migration and utilisation growth. Consequently, expenditure and accounting recognition may precede steady-state revenue generation.
The Company's priorities for the second half of 2026 are to:
Gorilla is increasing its Q3 2026 revenue planning range to approximately US$48 million to US$50 million, compared with its previous planning range of US$36 million to US$40 million. Gorilla now expects revenue for the 2026 fiscal year of at least US$200 million, raising the minimum from its previously announced range of US$160 million to US$200 million.
2027 guidance
Gorilla is targeting a revenue range of US$450 to US$500 million in 2027, with substantial gross margin improvement.
This objective is supported by the infrastructure being installed in connection with previously disclosed projects, the opportunity to increase utilisation, the potential to expand existing customer relationships and Gorilla's pipeline of additional demand. The objective remains subject to execution, customer demand, deployment schedules and prevailing market conditions.
Financials
Gorilla Technology Group Inc. and Subsidiaries
Condensed Interim Consolidated Balance Sheets
(Expressed in United States dollars)
Gorilla Technology Group Inc. and Subsidiaries
Condensed Interim Consolidated Statements of Comprehensive Loss
(Expressed in United States dollars)
Gorilla Technology Group Inc. and Subsidiaries
Condensed Interim Consolidated Statements of Cash Flows
(Expressed in United States dollars)
Reconciliation of non-IFRS Financial Measures to IFRS Measures
In addition to its reported results in accordance with International Financial Reporting Standards ("IFRS") followed by the Company, it has included in this release certain financial measures that are considered non-IFRS financial measures, including the following:
(i) Earnings before interest, taxes, depreciation, and amortization ("EBITDA");
(ii) Adjusted EBITDA; and
(iii) Adjusted net income (loss) and adjusted earnings (loss) per share.
Reconciliation of Operating Loss to EBITDA and Adjusted EBITDA
Reconciliation of Net Loss and Loss per Share to Adjusted Net Income (Loss) and Adjusted Earnings (Loss) per Share
Notes:
About Gorilla Technology Group Inc.
Headquartered in London U.K., Gorilla is a global solution provider in Security Intelligence, Network Intelligence, Business Intelligence, IoT technology and data centers. We provide a wide range of solutions, including Smart City, Network, Video, Security Convergence and IoT, across select verticals of Government and Public Services, Manufacturing, Telecom, Retail, Transportation and Logistics, Healthcare and Education, by using AI and Deep Learning Technologies.
Our expertise lies in revolutionizing urban operations, bolstering security and enhancing resilience. We deliver pioneering products that harness the power of AI in intelligent video surveillance, facial recognition, license plate recognition, edge computing, post-event analytics and advanced cybersecurity technologies. By integrating these AI-driven technologies, we empower Smart Cities to enhance efficiency, safety and cybersecurity measures, ultimately improving the quality of life for residents.
For more information, please visit our website: Gorilla-Technology.com.
Forward-Looking Statements
This press release contains "forward-looking statements" within the meaning of the "safe harbor" provisions of the Private Securities Litigation Reform Act of 1995. Gorilla's actual results may differ from its expectations, estimates and projections and consequently, you should not rely on these forward-looking statements as predictions of future events. Words such as "expect," "estimate," "project," "budget," "forecast," "anticipate," "intend," "plan," "may," "will," "could," "should," "believes," "predicts," "potential," "might" and "continues," and similar expressions are intended to identify such forward-looking statements. These forward-looking statements include, without limitation, statements regarding our beliefs about the expected timing and amount of revenues that may be recognized under our existing contracts during the second half of 2026 and during 2027, our ability to sign new contracts and execute existing contracts, equipment deployment schedules and overall market conditions, along with those other risks described under the heading "Risk Factors" in the Form 20-F Gorilla filed with the Securities and Exchange Commission (the "SEC") on April 15, 2026 and those that are included in any of Gorilla's future filings with the SEC. These forward-looking statements involve significant risks and uncertainties that could cause actual results to differ materially from expected results. Most of these factors are outside of the control of Gorilla and are difficult to predict. Should one or more of these risks or uncertainties materialize, or should underlying assumptions prove incorrect, actual results may vary materially from those indicated or anticipated by such forward-looking statements. Readers are cautioned not to place undue reliance upon any forward-looking statements, which speak only as of the date made. Gorilla undertakes no obligation to update forward-looking statements to reflect events or circumstances after the date they were made except as required by law or applicable regulation.
Investor Relations Contact
Dave Gentry
RedChip Companies, Inc.
1-407-644-4256
GRRR@redchip.com
Gorilla delivered a significant acceleration in revenue and a marked sequential improvement in reported operating performance during the second quarter. The outperformance was principally driven by earlier-than-anticipated delivery across multiple contracted customer programmes, enabling the Company to recognize the associated revenue ahead of its original expectations. This was complemented by continued execution across Gorilla's broader portfolio.
Financial highlights
- - H1 revenue nearly doubled: Revenue increased 99.3% to
approximately US$78.4 million, compared with US$39.3 million in H1 2025.
Growth was driven by the scaling of Gorilla's AI infrastructure and
data-centre programmes, alongside continued delivery across its security
intelligence, network intelligence and smart-city operations, including
Egypt, Taiwan and Thailand.
- - Reported and adjusted operating performance: Gorilla reported
an IFRS operating loss of approximately US$47.2 million for H1 2026,
compared with US$9.1 million in H1 2025. The 2026 results included
approximately US$25.4 million of stock-based compensation expense,
US$4.0 million of downward fair-value measurement effects, US$2.0
million of debt-transaction costs and US$0.3 million of
acquisition-related expenses. Adjusted EBITDA was a loss of
approximately US$14.6 million, compared with adjusted EBITDA of
approximately US$6.2 million in H1 2025.
- - Reported and adjusted net result: Gorilla reported an IFRS
net loss of approximately US$46.9 million for H1 2026, compared with
US$8.5 million in H1 2025. Adjusted net loss was approximately US$15.6
million, or US$0.58 per share, compared with adjusted net income of
approximately US$6.3 million, or US$0.32 per share, in H1 2025.
- - Operating cash efficiency improved year on year: Net cash
used in operating activities declined by approximately US$8.2 million,
or 65.3%, from US$12.5 million in H1 2025 to US$4.3 million in H1 2026.
- - Cash position strengthened: Cash increased by approximately
US$79.8 million during H1, driven principally by financing inflows and
supported by customer collections. Gorilla closed the period with
approximately US$179.4 million in cash.
- - Infrastructure investment accelerated: Gorilla deployed
approximately US$14.1 million during H1 for the acquisition of property
and equipment, including capital advances and project work-in-progress.
Property and equipment, including capital work-in-progress, reached
approximately US$29.4 million at June 30, 2026.
Comparative financial performance
| Financial measure | H1 2026 | H1 2025 |
| Operating loss (IFRS) | US$(47.2)m | US$(9.1)m |
| EBITDA loss (non-IFRS) | US$(46.4)m | US$(8.4)m |
| Adjusted EBITDA (non-IFRS) | US$(14.6)m | US$6.2m |
| Net loss (IFRS) | US$(46.9)m | US$(8.5)m |
| Adjusted net income (loss) (non-IFRS) | US$(15.6)m | US$6.3m |
| Diluted loss per share (IFRS) | US$(1.74) | US$(0.43) |
| Adjusted diluted earnings (loss) per share (non-IFRS) | US$(0.58) | US$0.30 |
Statement from Jay Chandan, Chairman and Chief Executive Officer
"This is the clearest evidence yet that Gorilla has entered a different phase of scale," said Jay Chandan, Chairman & CEO.
"In one year we managed to nearly double our first half revenue to US$78.4 million. Our second quarter revenue increased 78% sequentially and 138% year-on-year to US$50.1 million, while our reported operating loss narrowed by approximately 85% compared with Q1.
The progression matters. In the first half, we absorbed a significant share-based compensation charge largely tied to services rendered prior to 2025 and other significant accounting effects. With their removal during the first half of 2026, we are poised for an improvement in operating results.
We are now converting years of preparation into delivery at scale. We are investing in hardware, infrastructure, people and execution capacity because we see a substantial opportunity ahead of us. Infrastructure cannot be switched on like a tap. Equipment must be procured, installed, commissioned and integrated. Customers must migrate workloads and utilisation must then progress toward steady-state levels.
That investment is happening now. During H1, Gorilla deployed approximately US$14.1 million for the acquisition of property and equipment, while property and equipment, including capital work-in-progress, reached approximately US$29.4 million at June 30, 2026. We are building the capacity and delivery platform required to support a much larger business. Our priorities for the remainder of 2026 are unambiguous: bring more capacity into service, increase utilisation, expand the workloads we deliver for existing customers and convert additional demand into revenue. We are on track to meet previously announced delivery timelines. The objective is not simply to deploy hardware. It is to build long-term customer relationships around infrastructure, compute and associated services."
Statement from Bruce Bower, Chief Financial Officer
"The first-half results demonstrate both the scale of Gorilla's investment and the improvement in cash efficiency," said Bruce Bower, Chief Financial Officer.
"On an IFRS basis, Gorilla reported an operating loss of approximately US$47.2 million and a net loss of approximately US$46.9 million. Adjusted EBITDA was a loss of approximately US$14.6 million, and adjusted net loss was approximately US$15.6 million. The reconciliation included below provides investors with the individual adjustments and their respective treatment."
"H1 revenue increased 99.3%, while net cash used in operating activities declined by approximately US$8.2 million, or 65.3%, to US$4.3 million. Put simply, we nearly doubled revenue while reducing operating cash usage from 31.8% to 5.5% of revenue."
"This improvement was achieved while Gorilla deployed approximately US$14.1 million during H1 for the acquisition of property and equipment. Cash deployment may increase as we fund equipment purchases, project-related deposits, construction and commissioning activities. These expenditures represent the planned conversion of liquidity into productive infrastructure and delivery capacity intended to support future revenue-not a weakening of our underlying operating discipline."
"The Company recorded an overall increase in cash of approximately US$79.8 million during H1, driven principally by financing inflows and supported by customer collections. We closed the period with approximately US$179.4 million in cash. As this liquidity is deployed, our cash balance may fluctuate as we fund existing projects and build the capacity required to support future revenue."
"We are investing ahead of the revenue and utilisation curve, but we are doing so from a position of substantial liquidity. Our priorities remain disciplined capital allocation, project execution, improved utilisation and the conversion of infrastructure investment into sustainable revenue and cash flow."
Infrastructure investment and the path to steady state
Gorilla's current financial profile reflects the deliberate acceleration of its AI infrastructure strategy.
Infrastructure projects require capital to be deployed before their full revenue and margin potential can be realized. Hardware procurement is followed by installation, commissioning, integration, customer onboarding, workload migration and utilisation growth. Consequently, expenditure and accounting recognition may precede steady-state revenue generation.
The Company's priorities for the second half of 2026 are to:
- Bring additional infrastructure capacity into service.
- Increase utilisation across existing deployments.
- Expand the range of workloads delivered for existing customers.
- Onboard new customers and convert additional demand.
- Develop a broader revenue mix across infrastructure, compute and associated services.
- Maintain disciplined capital allocation and liquidity management while investing for growth.
Gorilla is increasing its Q3 2026 revenue planning range to approximately US$48 million to US$50 million, compared with its previous planning range of US$36 million to US$40 million. Gorilla now expects revenue for the 2026 fiscal year of at least US$200 million, raising the minimum from its previously announced range of US$160 million to US$200 million.
2027 guidance
Gorilla is targeting a revenue range of US$450 to US$500 million in 2027, with substantial gross margin improvement.
This objective is supported by the infrastructure being installed in connection with previously disclosed projects, the opportunity to increase utilisation, the potential to expand existing customer relationships and Gorilla's pipeline of additional demand. The objective remains subject to execution, customer demand, deployment schedules and prevailing market conditions.
Financials
Gorilla Technology Group Inc. and Subsidiaries
Condensed Interim Consolidated Balance Sheets
(Expressed in United States dollars)
| As of | ||||||||||
| June 30, 2026 | December 31, 2025 | |||||||||
| Items | (Unaudited and Unreviewed) | |||||||||
| Assets | ||||||||||
| Current assets | ||||||||||
| Cash and cash equivalents | $ | 179,361,146 | $ | 99,532,115 | ||||||
| Restricted deposits | 45,933 | 5,298,442 | ||||||||
| Accounts receivable, net and contract assets | 145,301,296 | 111,994,621 | ||||||||
| Other current assets | 20,045,479 | 17,221,988 | ||||||||
| Total current assets | 344,753,854 | 234,047,166 | ||||||||
| Non-current assets | ||||||||||
| Property and equipment, net | 29,441,217 | 15,749,411 | ||||||||
| Right-of-use assets | 1,055,377 | 1,091,526 | ||||||||
| Goodwill and other intangible assets | 3,360,361 | 2,432,278 | ||||||||
| Deferred tax assets, net | 5,201,078 | 11,938,173 | ||||||||
| Other non-current assets | 6,072,360 | 6,624,980 | ||||||||
| Total non-current assets | 45,130,393 | 37,836,368 | ||||||||
| Total assets | $ | 389,884,247 | $ | 271,883,534 | ||||||
| Liabilities and Equity | ||||||||||
| Liabilities | ||||||||||
| Current liabilities | ||||||||||
| Borrowings | $ | 10,221,241 | $ | 10,391,379 | ||||||
| Derivative liability | 48,200,000 | - | ||||||||
| Accounts and other payables | 91,708,655 | 46,042,759 | ||||||||
| Contract liabilities | 1,523,600 | 1,305,644 | ||||||||
| Income tax liabilities | 1,378,280 | 11,588,564 | ||||||||
| Other current liabilities | 899,764 | 951,094 | ||||||||
| Total current liabilities | 153,931,540 | 70,279,440 | ||||||||
| Non-current liabilities | ||||||||||
| Long-term borrowings | 63,025,823 | 3,404,363 | ||||||||
| Deferred tax liabilities | 827,315 | 652,782 | ||||||||
| Other non-current liabilities | 1,246,054 | 1,467,110 | ||||||||
| Total non-current liabilities | 65,099,192 | 5,524,255 | ||||||||
| Total liabilities | 219,030,732 | 75,803,695 | ||||||||
| Equity | ||||||||||
| Share capital | 27,664 | 26,356 | ||||||||
| Treasury shares at cost | (5,285,347) | (2,105,274) | ||||||||
| Other equity | 176,111,198 | 198,158,757 | ||||||||
| Total equity | 170,853,515 | 196,079,839 | ||||||||
| Total liabilities and equity | $ | 389,884,247 | $ | 271,883,534 | ||||||
Gorilla Technology Group Inc. and Subsidiaries
Condensed Interim Consolidated Statements of Comprehensive Loss
(Expressed in United States dollars)
| Six Months Ended June 30, | ||||||||||
| 2026 | 2025 | |||||||||
| Items | (Unaudited and Unreviewed) | |||||||||
| Revenues | $ | 78,361,225 | $ | 39,325,839 | ||||||
| Cost of revenues | (74,516,947) | (25,877,004) | ||||||||
| Gross profit | 3,844,278 | 13,448,835 | ||||||||
| Operating expenses: | ||||||||||
| Foreign currency exchange losses, net | (2,594,853) | (11,552,001) | ||||||||
| Stock-based compensation expenses | (25,426,746) | (472,642) | ||||||||
| Other operating expenses | (23,003,400) | (10,494,639) | ||||||||
| Total operating expenses | (51,024,999) | (22,519,282) | ||||||||
| Operating loss | (47,180,721) | (9,070,447) | ||||||||
| Net loss | (46,893,714) | (8,503,060) | ||||||||
| Other comprehensive income (loss), net of tax | (748,898) | 1,057,235 | ||||||||
| Total comprehensive loss | $ | (47,642,612) | $ | (7,445,825) | ||||||
| Basic and diluted loss per share | $ | (1.74) | $ | (0.43) | ||||||
Gorilla Technology Group Inc. and Subsidiaries
Condensed Interim Consolidated Statements of Cash Flows
(Expressed in United States dollars)
| Six Months Ended June 30, | ||||||||||||
| 2026 | 2025 | |||||||||||
| (Unaudited and Unreviewed) | ||||||||||||
| Net cash used in operating activities | $ | (4,339,769) | $ | (12,518,511) | ||||||||
| Net cash used in investing activities | (12,675,421) | (4,852,819) | ||||||||||
| Net cash flows from financing activities | 98,511,610 | 5,334,134 | ||||||||||
| Effect of foreign exchange rate changes on cash and cash equivalents | (1,667,389) | 448,200 | ||||||||||
| Net increase (decrease) in cash and cash equivalents | $ | 79,829,031 | $ | (11,588,996) | ||||||||
| Cash and cash equivalents at beginning of the period | 99,532,115 | 21,699,202 | ||||||||||
| Cash and cash equivalents at end of the period | $ | 179,361,146 | $ | 10,110,206 | ||||||||
Reconciliation of non-IFRS Financial Measures to IFRS Measures
In addition to its reported results in accordance with International Financial Reporting Standards ("IFRS") followed by the Company, it has included in this release certain financial measures that are considered non-IFRS financial measures, including the following:
(i) Earnings before interest, taxes, depreciation, and amortization ("EBITDA");
(ii) Adjusted EBITDA; and
(iii) Adjusted net income (loss) and adjusted earnings (loss) per share.
Reconciliation of Operating Loss to EBITDA and Adjusted EBITDA
| Six Months Ended June 30, | |||||||||||
| 2026 | 2025 | ||||||||||
| (Unaudited and Unreviewed) | |||||||||||
| Items | (Amount in USD) | ||||||||||
| Operating loss (IFRS) | $ | (47,180,721) | $ | (9,070,447) | |||||||
| Add: Depreciation expenses | 588,726 | 325,824 | |||||||||
| Add: Amortization expenses | 181,200 | 317,806 | |||||||||
| EBITDA loss (non-IFRS) | $ | (46,410,795) | $ | (8,426,817) | |||||||
| Add: Foreign currency devaluation (1) | - | 12,630,726 | |||||||||
| Add: Fair value measurement of financial instruments, net (2) | 4,002,918 | 1,531,210 | |||||||||
| Add: Stock-based compensation expenses | 25,426,746 | 472,642 | |||||||||
| Add: Acquisition-related expenses (3) | 340,000 | - | |||||||||
| Add: Debt transaction costs (4) | 2,044,673 | - | |||||||||
| Adjusted EBITDA (non-IFRS) | $ | (14,596,458) | $ | 6,207,761 | |||||||
Reconciliation of Net Loss and Loss per Share to Adjusted Net Income (Loss) and Adjusted Earnings (Loss) per Share
| Six Months Ended June 30, | |||||||||||||||||||||
| 2026 | 2025 | ||||||||||||||||||||
| (Unaudited and Unreviewed) | |||||||||||||||||||||
| (Amount in USD) | |||||||||||||||||||||
| Items | Amount | Per share | Amount | Per share | |||||||||||||||||
| Net loss (IFRS) | $ | (46,893,714) | $ | (1.74) | $ | (8,503,060) | $ | (0.43) | |||||||||||||
| Add: Foreign currency devaluation (1) | - | - | 12,630,726 | 0.64 | |||||||||||||||||
| Add: Fair value measurement of financial instruments, net (2) | 4,002,918 | 0.15 | 1,531,210 | 0.08 | |||||||||||||||||
| Add: Stock-based compensation expenses | 25,426,746 | 0.94 | 472,642 | 0.02 | |||||||||||||||||
| Less: Tax effects of stock-based compensation expenses | (727,217) | (0.03) | (21,145) | - | |||||||||||||||||
| Add: Acquisition-related expenses (3) | 340,000 | 0.01 | - | - | |||||||||||||||||
| Add: Debt transaction costs (4) | 2,044,673 | 0.08 | - | - | |||||||||||||||||
| Add: Amortization of acquired intangible assets (5) | 171,000 | 0.01 | 171,000 | 0.01 | |||||||||||||||||
| Adjusted net income (loss) (non-IFRS) | $ | (15,635,594) | $ | (0.58) | $ | 6,281,373 | $ | 0.32 | |||||||||||||
| Adjusted diluted earnings (loss) per share (non-IFRS) | $ | (0.58) | $ | 0.30 | |||||||||||||||||
Notes:
- Foreign currency devaluation - effects of material depreciation of the Egyptian pound against the U.S. dollar.
- Fair value measurement of financial instruments - includes effects of fair value measurement of stock warrants and derivative liabilities.
- Acquisition-related expenses - includes expenses incurred for acquisition of Shackleton Finance Limited in June 2026.
- Debt transaction costs - includes the portion allocated to derivative liabilities for one-time issuance costs incurred in connection with the convertible notes.
- Amortization of acquired intangible assets - includes non-cash amortization expense related to acquired intangible assets.
About Gorilla Technology Group Inc.
Headquartered in London U.K., Gorilla is a global solution provider in Security Intelligence, Network Intelligence, Business Intelligence, IoT technology and data centers. We provide a wide range of solutions, including Smart City, Network, Video, Security Convergence and IoT, across select verticals of Government and Public Services, Manufacturing, Telecom, Retail, Transportation and Logistics, Healthcare and Education, by using AI and Deep Learning Technologies.
Our expertise lies in revolutionizing urban operations, bolstering security and enhancing resilience. We deliver pioneering products that harness the power of AI in intelligent video surveillance, facial recognition, license plate recognition, edge computing, post-event analytics and advanced cybersecurity technologies. By integrating these AI-driven technologies, we empower Smart Cities to enhance efficiency, safety and cybersecurity measures, ultimately improving the quality of life for residents.
For more information, please visit our website: Gorilla-Technology.com.
Forward-Looking Statements
This press release contains "forward-looking statements" within the meaning of the "safe harbor" provisions of the Private Securities Litigation Reform Act of 1995. Gorilla's actual results may differ from its expectations, estimates and projections and consequently, you should not rely on these forward-looking statements as predictions of future events. Words such as "expect," "estimate," "project," "budget," "forecast," "anticipate," "intend," "plan," "may," "will," "could," "should," "believes," "predicts," "potential," "might" and "continues," and similar expressions are intended to identify such forward-looking statements. These forward-looking statements include, without limitation, statements regarding our beliefs about the expected timing and amount of revenues that may be recognized under our existing contracts during the second half of 2026 and during 2027, our ability to sign new contracts and execute existing contracts, equipment deployment schedules and overall market conditions, along with those other risks described under the heading "Risk Factors" in the Form 20-F Gorilla filed with the Securities and Exchange Commission (the "SEC") on April 15, 2026 and those that are included in any of Gorilla's future filings with the SEC. These forward-looking statements involve significant risks and uncertainties that could cause actual results to differ materially from expected results. Most of these factors are outside of the control of Gorilla and are difficult to predict. Should one or more of these risks or uncertainties materialize, or should underlying assumptions prove incorrect, actual results may vary materially from those indicated or anticipated by such forward-looking statements. Readers are cautioned not to place undue reliance upon any forward-looking statements, which speak only as of the date made. Gorilla undertakes no obligation to update forward-looking statements to reflect events or circumstances after the date they were made except as required by law or applicable regulation.
Investor Relations Contact
Dave Gentry
RedChip Companies, Inc.
1-407-644-4256
GRRR@redchip.com
📢 Publisir Berita & Kegiatan Instansi Anda di RiauGreen
Jangkau pembaca luas & terindeks Google News. Pilih paket rilis pers, advertorial, atau kemitraan media.
BERITA LAINNYA
Selasa, 25 Agustus 2026 | 10:31

Selasa, 25 Agustus 2026 | 10:27
Selasa, 25 Agustus 2026 | 10:17

Senin, 24 Agustus 2026 | 21:22
Senin, 24 Agustus 2026 | 21:22

Senin, 24 Agustus 2026 | 21:21
Senin, 24 Agustus 2026 | 21:20
Senin, 24 Agustus 2026 | 21:17
Senin, 24 Agustus 2026 | 20:59
Senin, 24 Agustus 2026 | 20:59
Senin, 24 Agustus 2026 | 20:57
BERIKAN KOMENTAR


-

-
Selasa, 25 Agustus 2026 | 10:31
Gorilla Technology H1 Revenue Surges 99% to US$78.4 Million; Raises FY2026 Revenue Outlook to at Least US$200 Million
-
Selasa, 25 Agustus 2026 | 10:27
First summer vacation season after the opening of the world's highest bridge
-
Selasa, 25 Agustus 2026 | 10:17
Hohhot, Inner Mongolia: Converting Prairie Winds into Computing Power
-
 Senin, 24 Agustus 2026 | 22:09
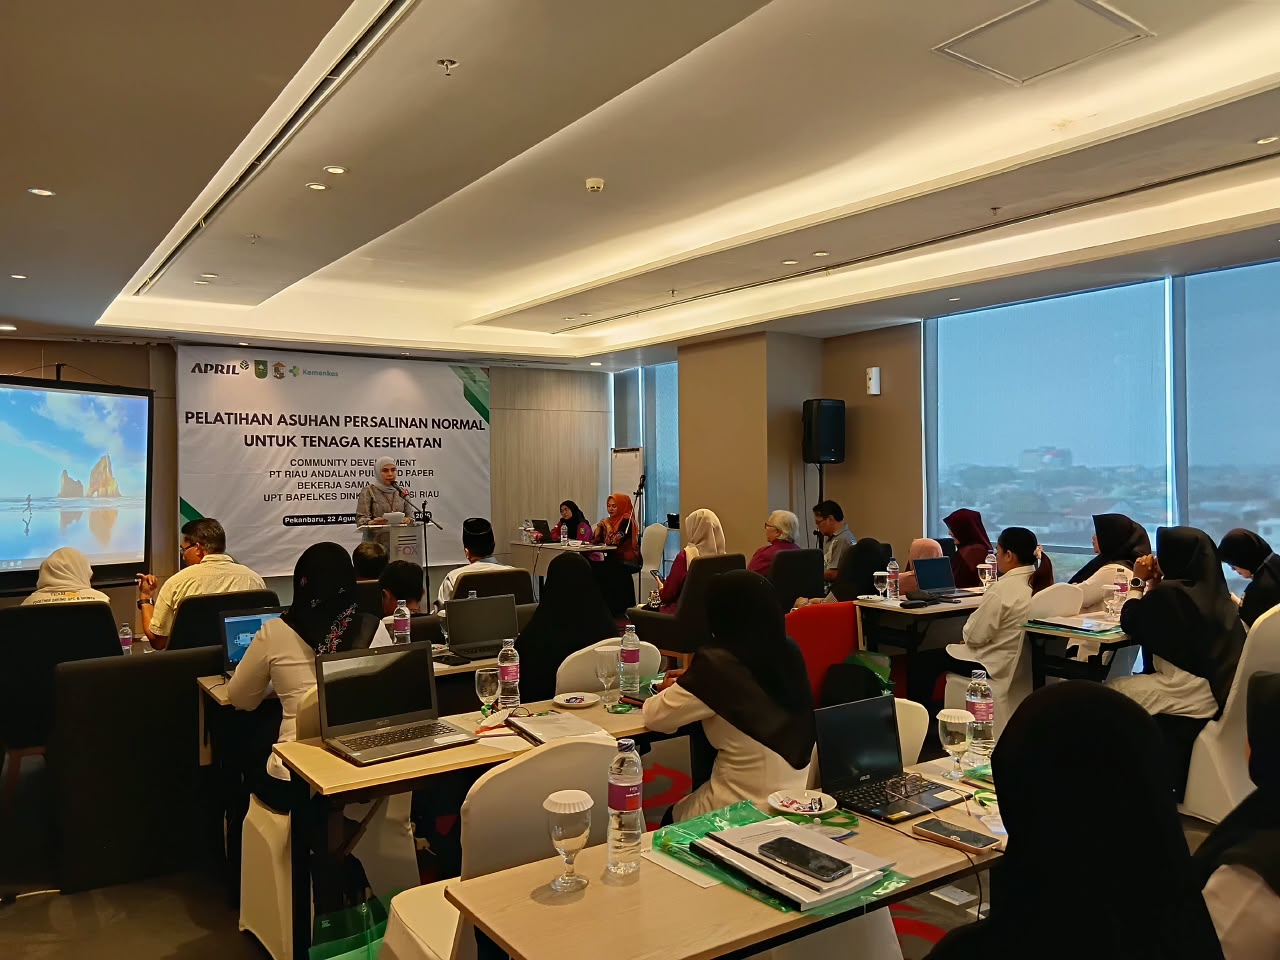
Pelatihan APN Untuk Nakes Pelalawan, Upaya Bersama Tekan Resiko Kematian Ibu dan Bayi
-
 Senin, 24 Agustus 2026 | 22:07
Pertamina Patra Niaga Raih Predikat Bintang 5 dan Boyong Penghargaan di Ajang ISEA 2026

-
 Selasa, 18 Agustus 2026 | 13:48
Kegiatan Bongkar Muat di Dermaga D Kawasan PT Pelindo Dumai Kembali Diduga Cemari Lingkungan
-
 Selasa, 18 Agustus 2026 | 22:35
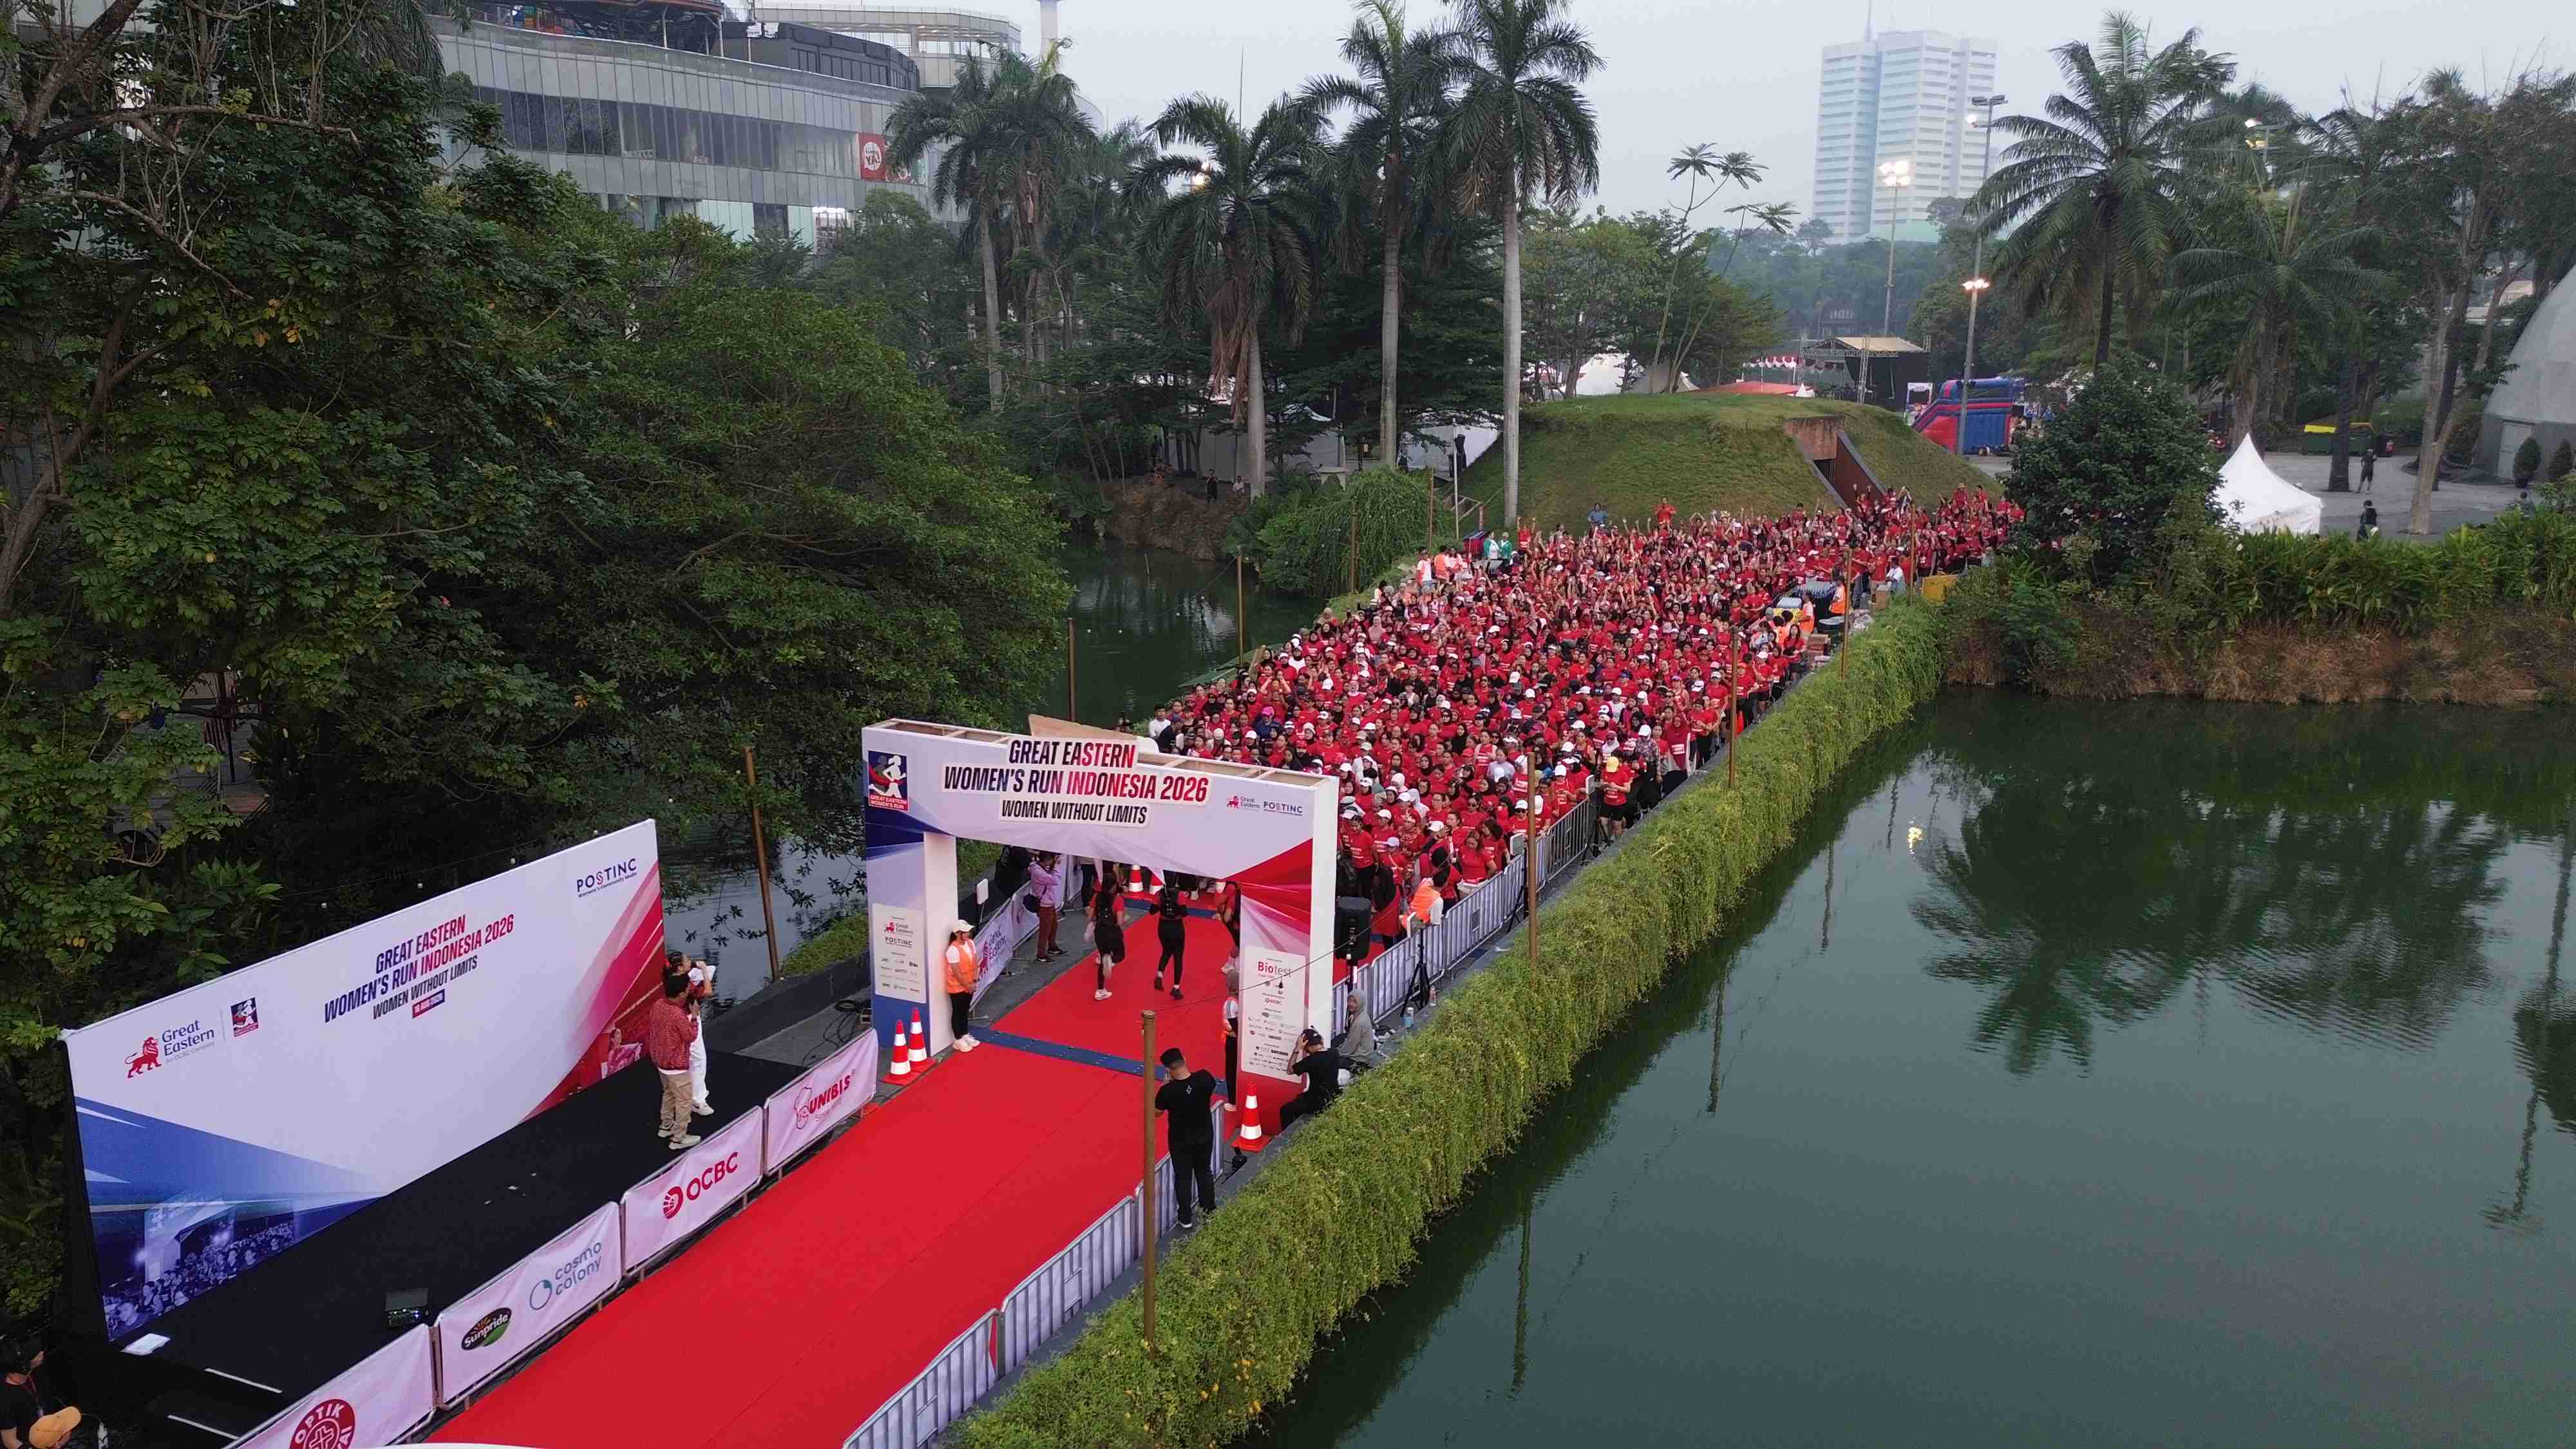
Great Eastern Women's Run Indonesia 2026 Hadirkan Pengalaman Lari yang Sehat, Suportif, dan Berdampak
-

-
 Kamis, 20 Agustus 2026 | 10:44
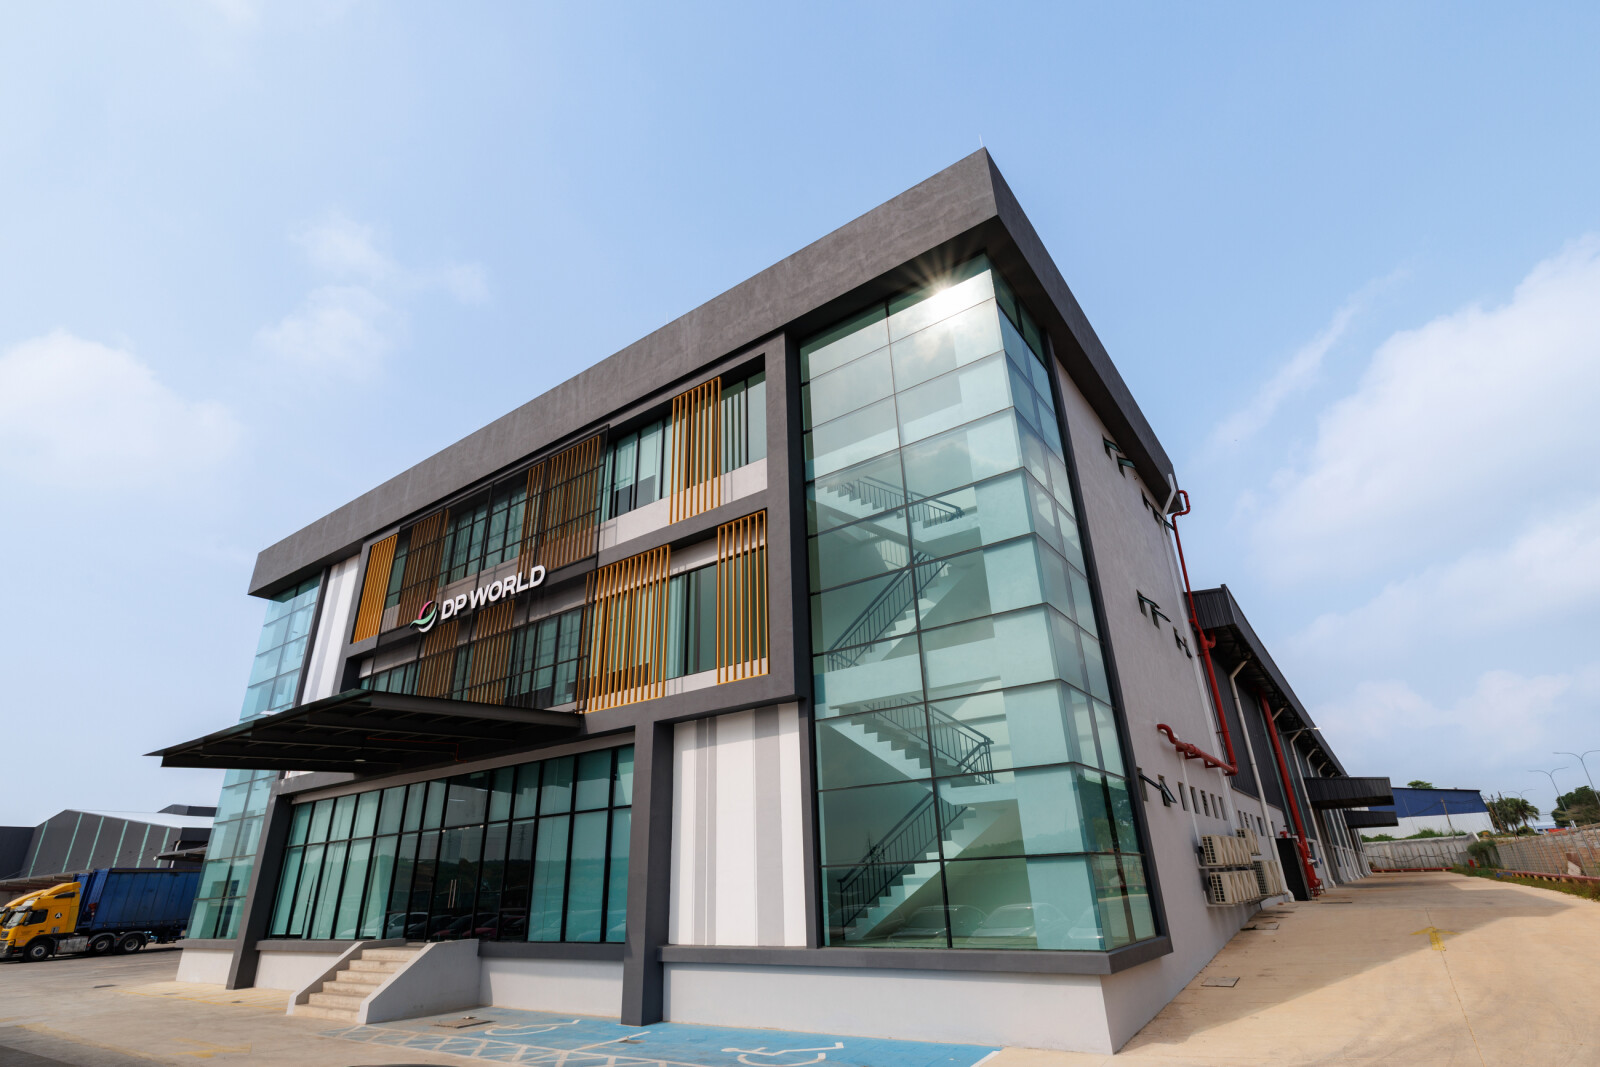
DP World Accelerates Contract Logistics Expansion Across Southeast Asia with New Warehouse in Malaysia
-
 Jumat, 21 Agustus 2026 | 01:59
Andrea Bocelli Merayakan Tur Peringatan 30 Tahun Romanza dengan Dua Konser Spektakuler di Indonesia
-